Spreadsheets
Excel & Google Sheets
Transforming messy raw data into clean, structured datasets using advanced formulas, Pivot Tables, and Power Query — the foundation of any reliable analytics pipeline.
SQL
Structured Query Language · SQL Server

Writing complex queries — multi-table joins, CTEs, Window Functions (RANK, LEAD/LAG), and Stored Procedures — to extract, transform, and diagnose large-scale business data.
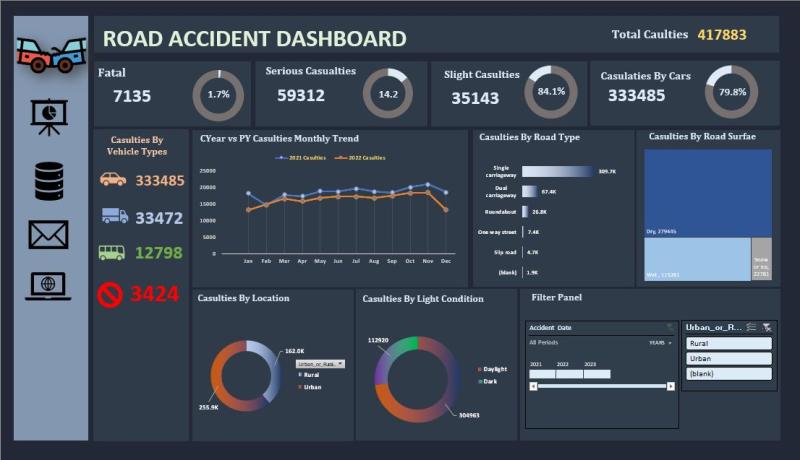
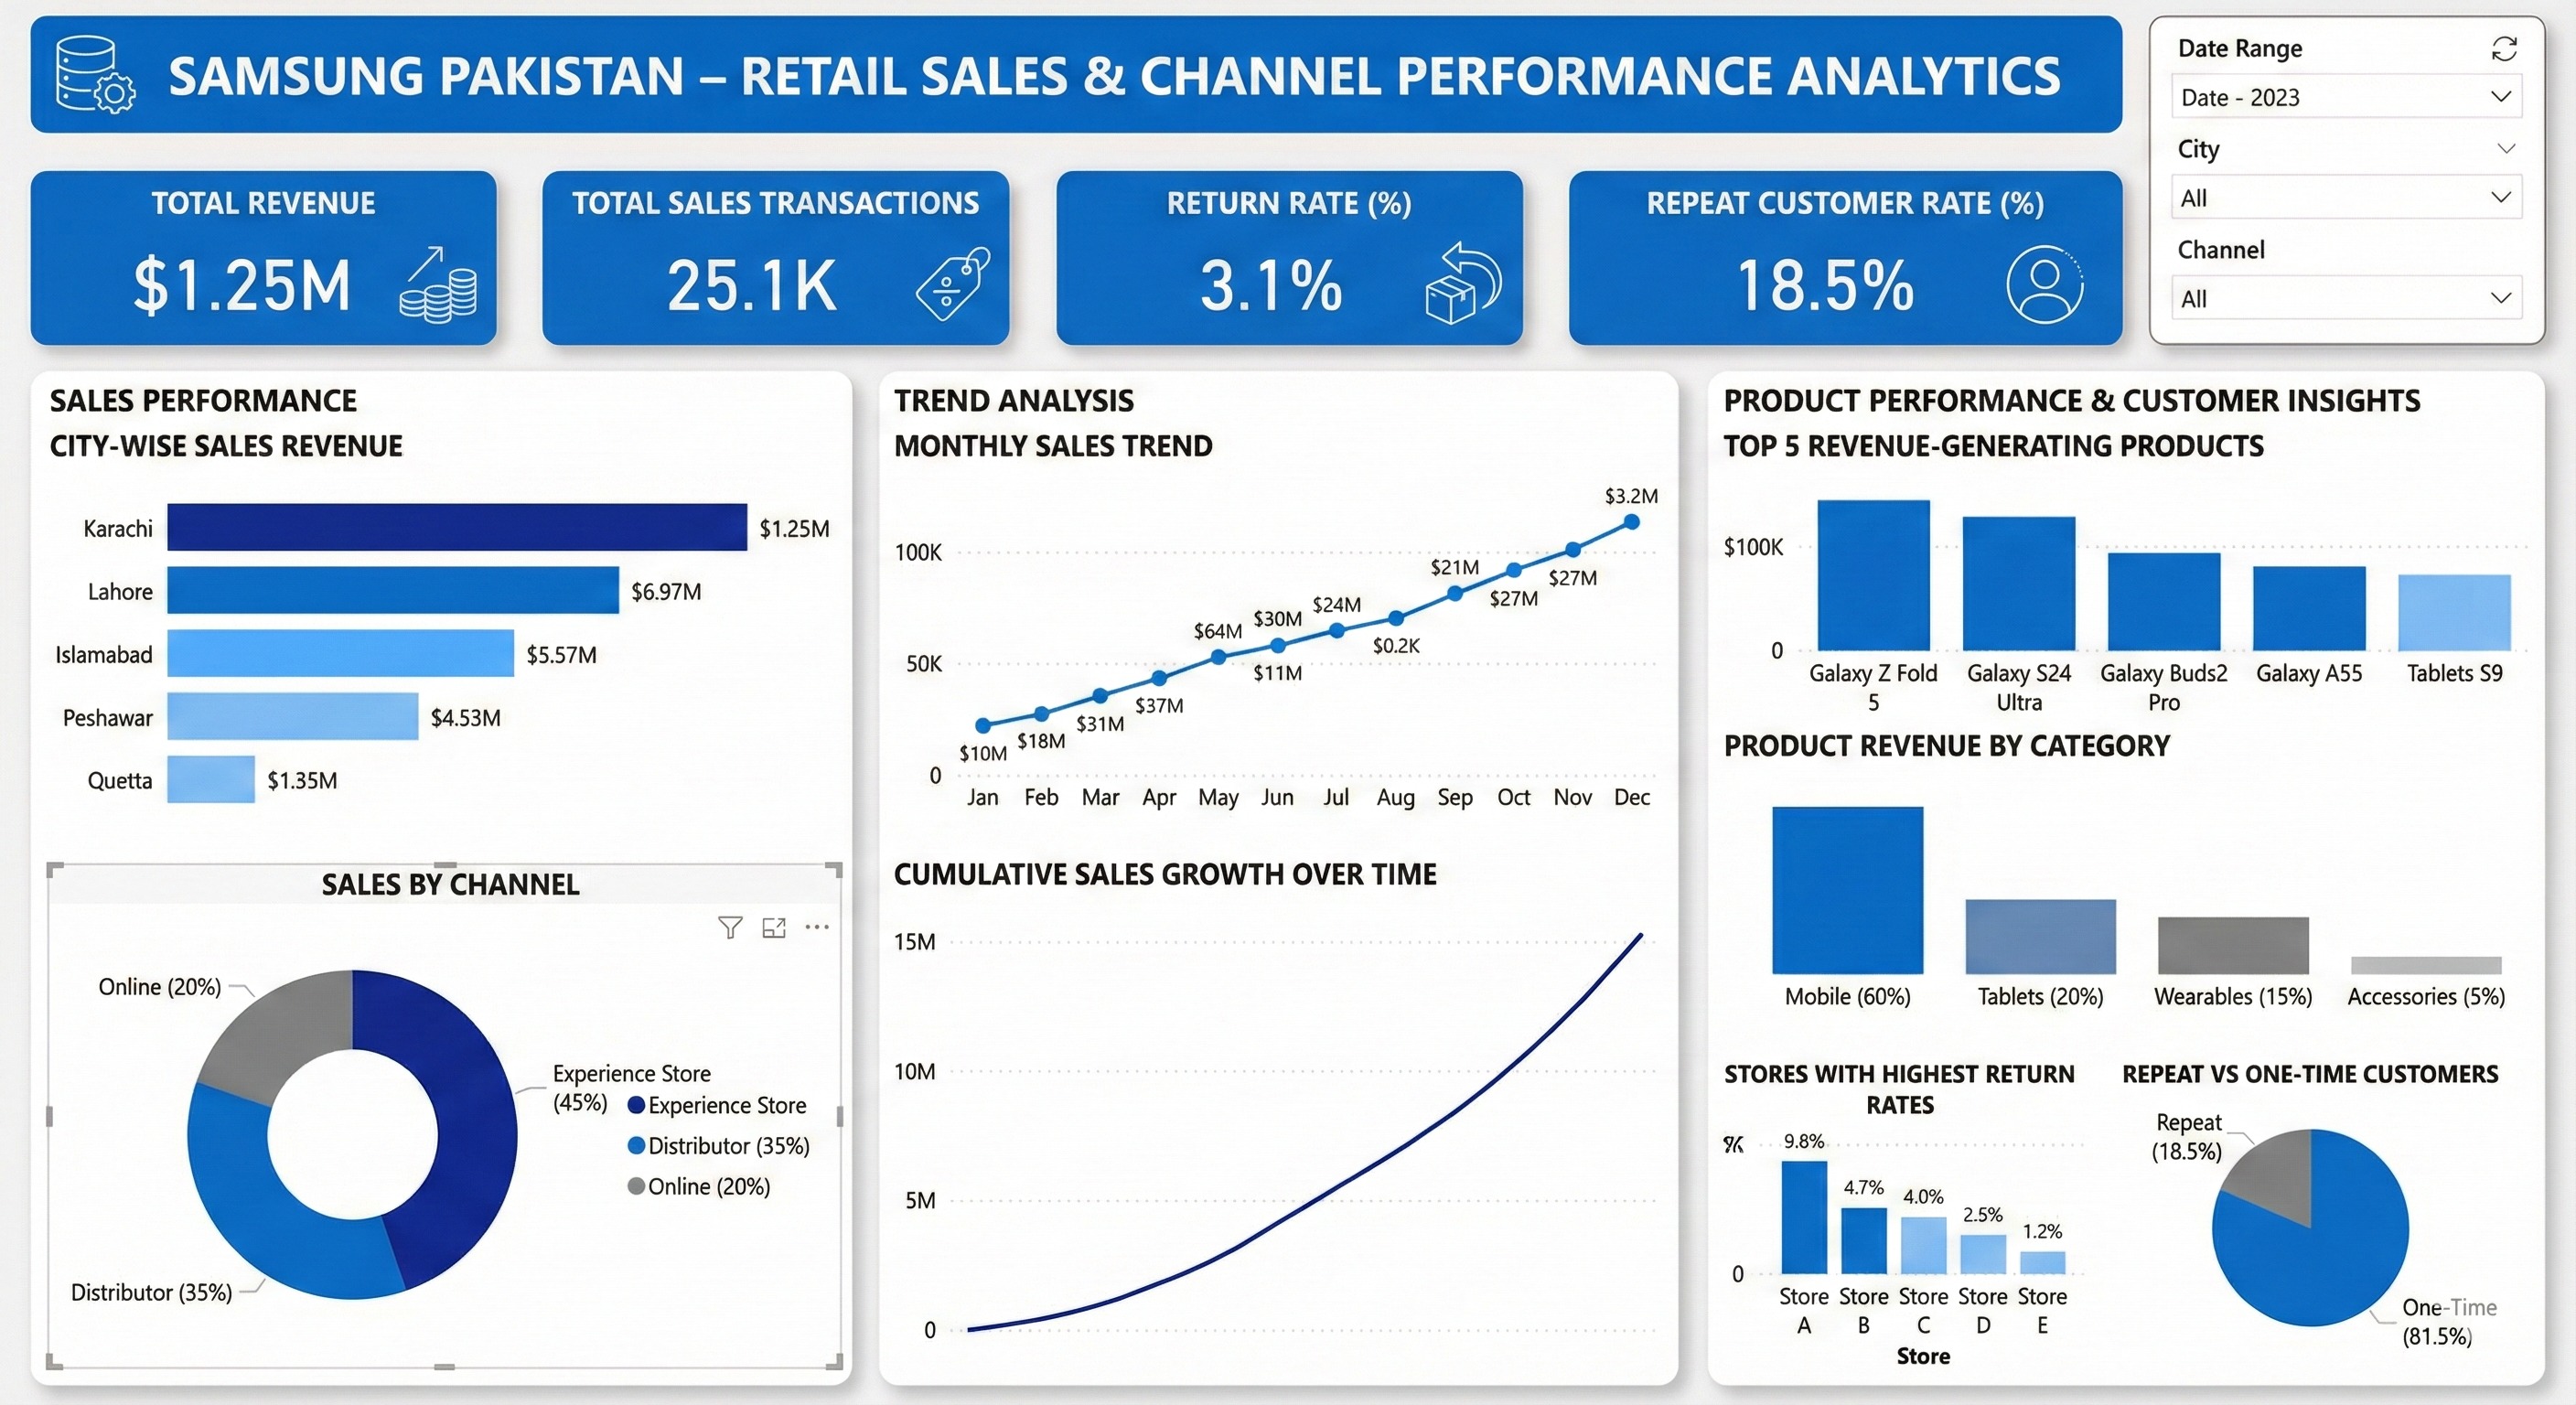
Power BI
Business Intelligence & Data Storytelling
Developing executive-ready interactive dashboards with DAX measures, drill-throughs, and compelling data stories that turn raw numbers into decisive business action.
Final Insights
Delivering Actionable Value to Stakeholders
Synthesizing outputs across all analytics stages into clear, strategic recommendations — bridging the gap between raw data and the business decisions that drive real growth.
Identify Patterns
Surface hidden trends across large datasets using statistical reasoning and domain context.
Communicate Clearly
Translate complex findings into concise, jargon-free narratives for non-technical stakeholders.
Drive Action
Deliver data-backed recommendations that are measurable, practical, and tied to business goals.