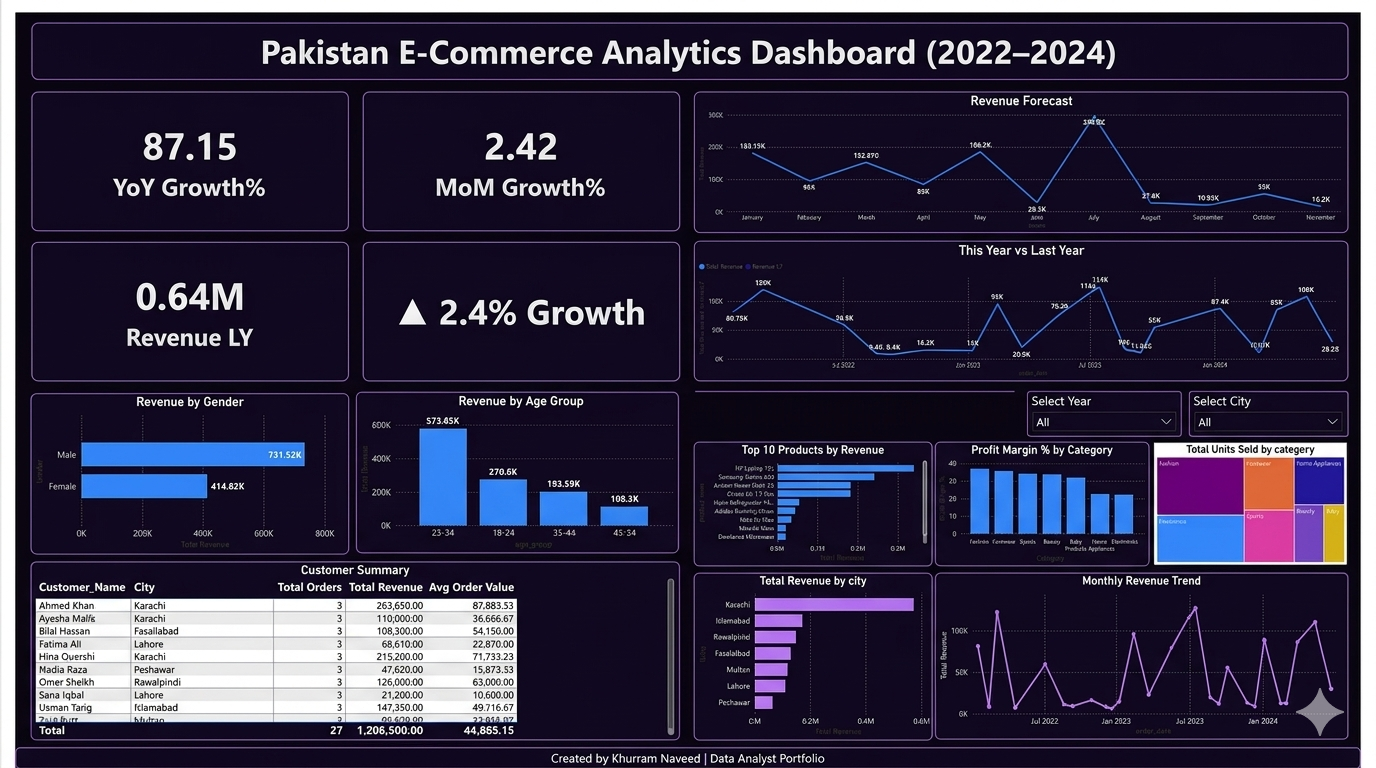
Analyzed PKR 1.21M revenue across 7 cities. Discovered Electronics drives 64% revenue but at thin margins (19%). Projected 25% revenue growth via Lahore & Faisalabad market expansion and digital payment incentives.
View on GitHub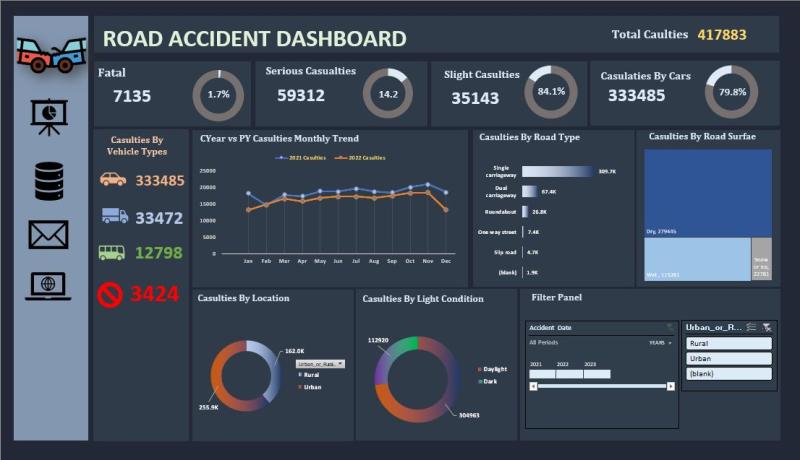
Analyzed 417,883 road casualties across vehicle type, road conditions and location. Cars responsible for 79.8% of all accidents (333K), single carriageway roads highest risk zone at 390K casualties, urban areas dominating over rural at 255K.
View on GitHub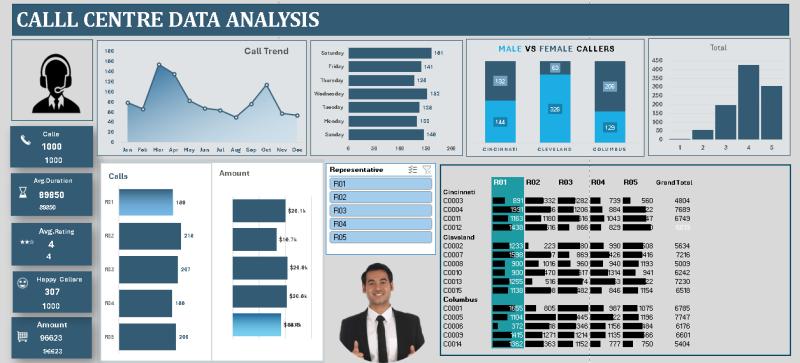
Analyzed 532 call-centre interactions totalling Rs.96K revenue. Male callers deliver 3x higher ticket size. Top agent F05 identified for script replication. Uncovered Rs.18K daily revenue opportunity through gender-specific upsell flow redesign.
View on GitHub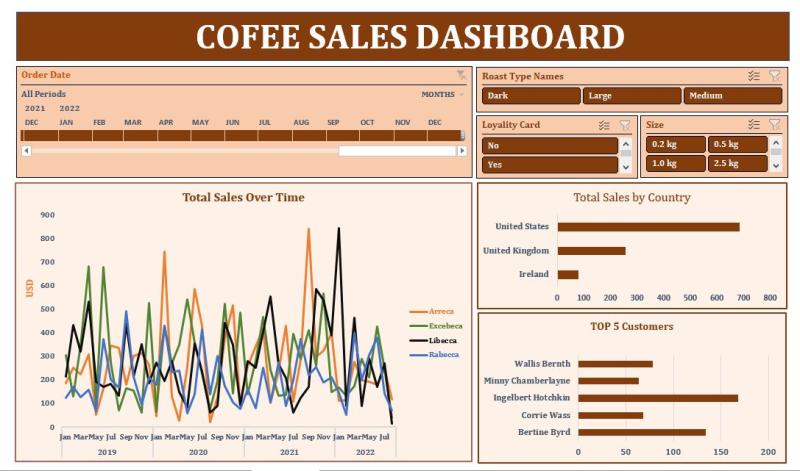
Analyzed coffee sales across 3 countries from 2019 to 2022. USA leads with ~750 units, top 5 customers drive disproportionate revenue, seasonal peaks in late 2019 and mid-2021 identified for inventory planning.
View on GitHub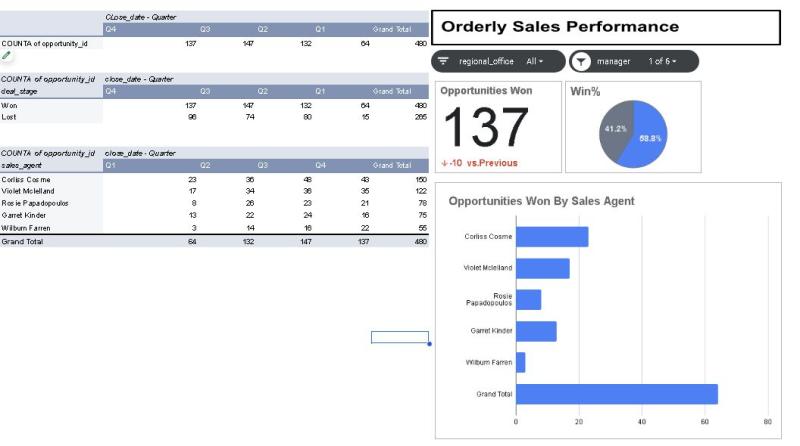
Built a CRM sales pipeline dashboard for SoftTech tracking leads, deal stages and conversion rates across the full sales funnel. Identified pipeline bottlenecks and enabled data-driven sales coaching decisions.
View on GitHub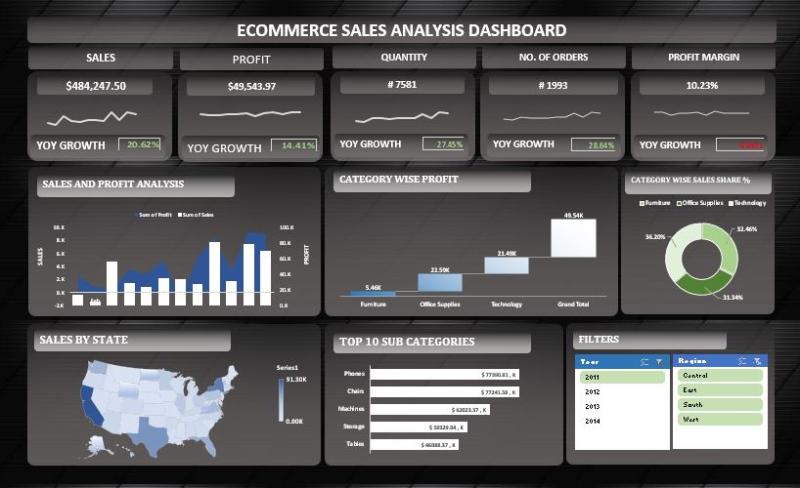
Analyzed $484K total sales and 20.6% YoY growth across 1,993 orders. Technology leads profit but margins are under pressure. Phones top-selling product, Central and West US regions dominate.
View on GitHub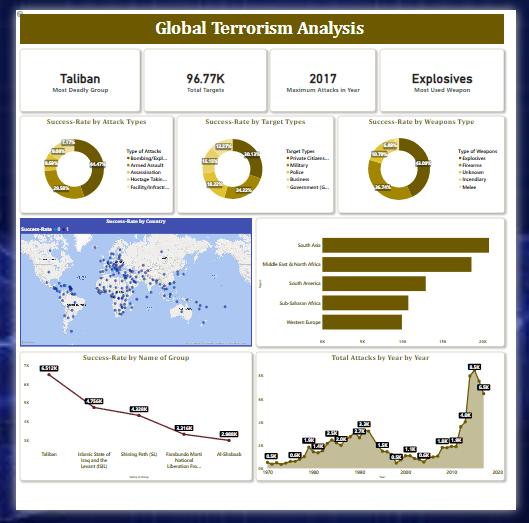
Analyzed 96,000+ terrorism records spanning 1970–2017. Taliban, ISIS and Boko Haram identified as deadliest groups. South Asia is the highest-risk region, 2017 the peak year, explosives the dominant weapon.
View on GitHub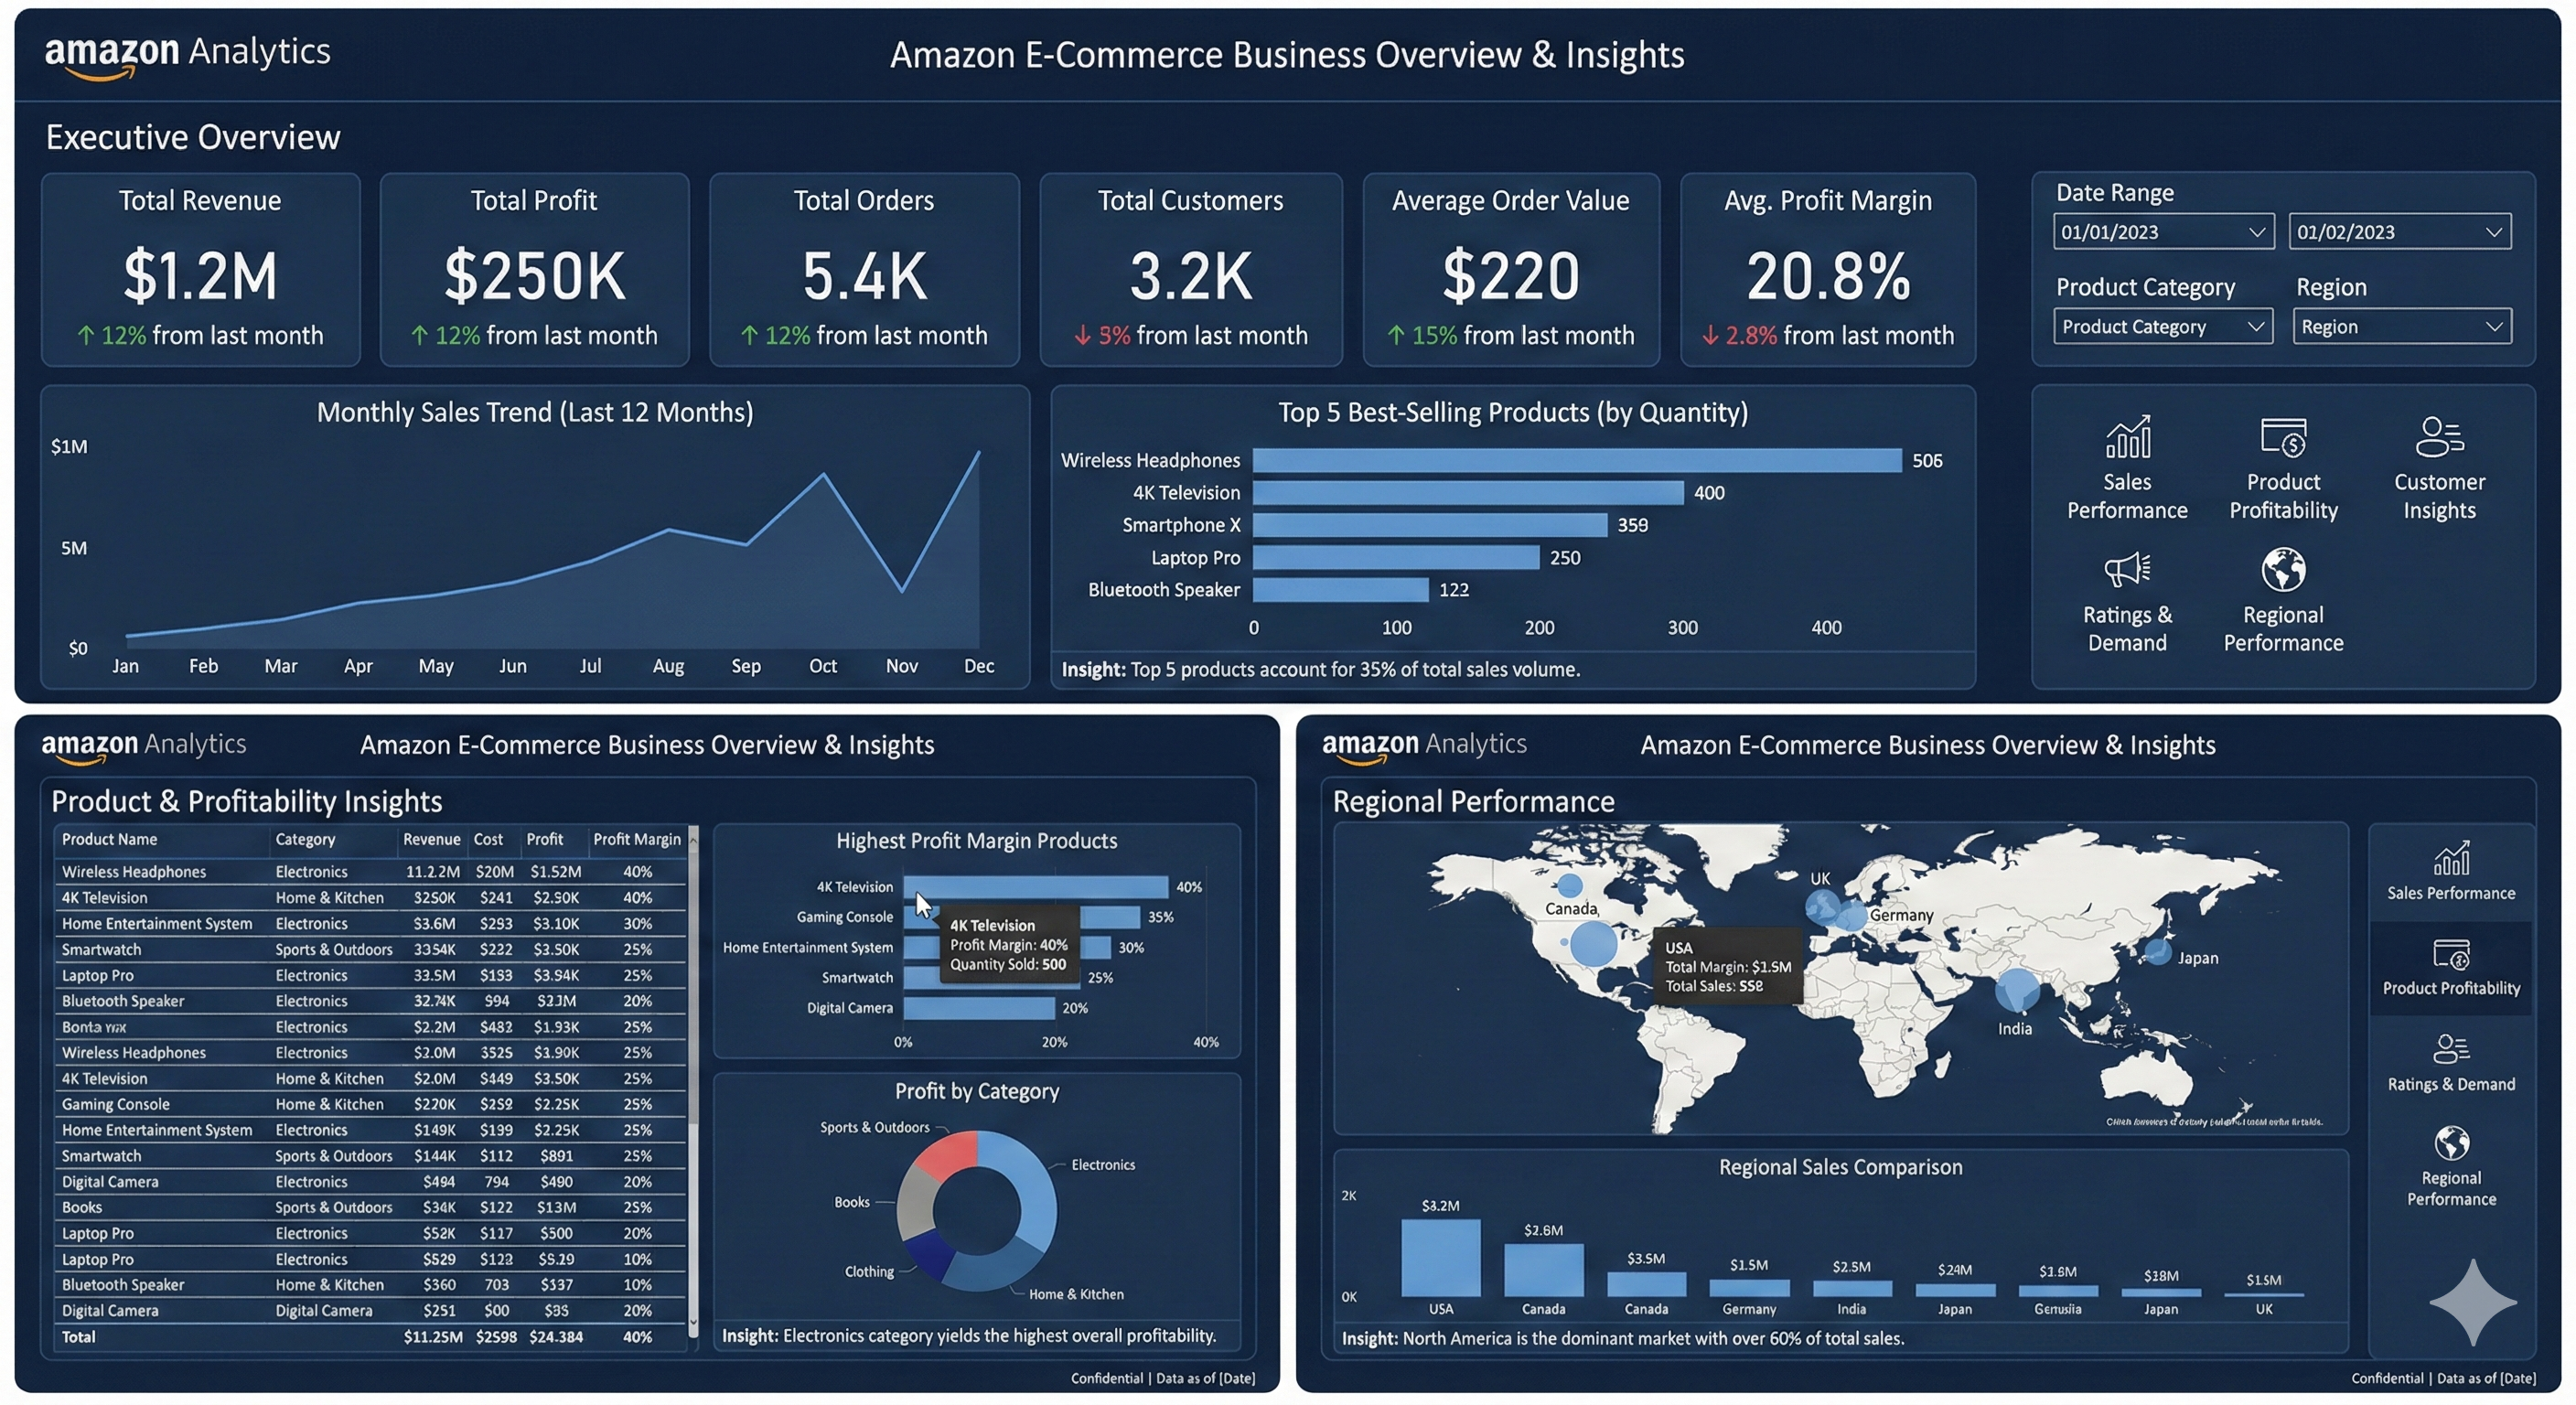
Executive dashboard analyzing $1.2M revenue across 5,400+ orders. Electronics top category, Wireless Headphones #1 product, 12% MoM growth. North America contributes 60%+ of total sales.
View on GitHub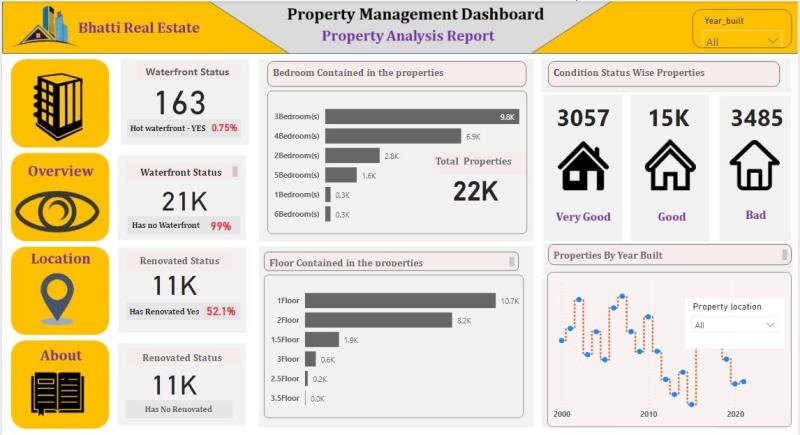
52% properties are renovated, 0.75% are ultra-premium waterfront, 76% are 3-4 bedroom family homes. Renovation ROI matrix, lifecycle planning and dynamic pricing strategy for underserved buyer segments included.
View on GitHub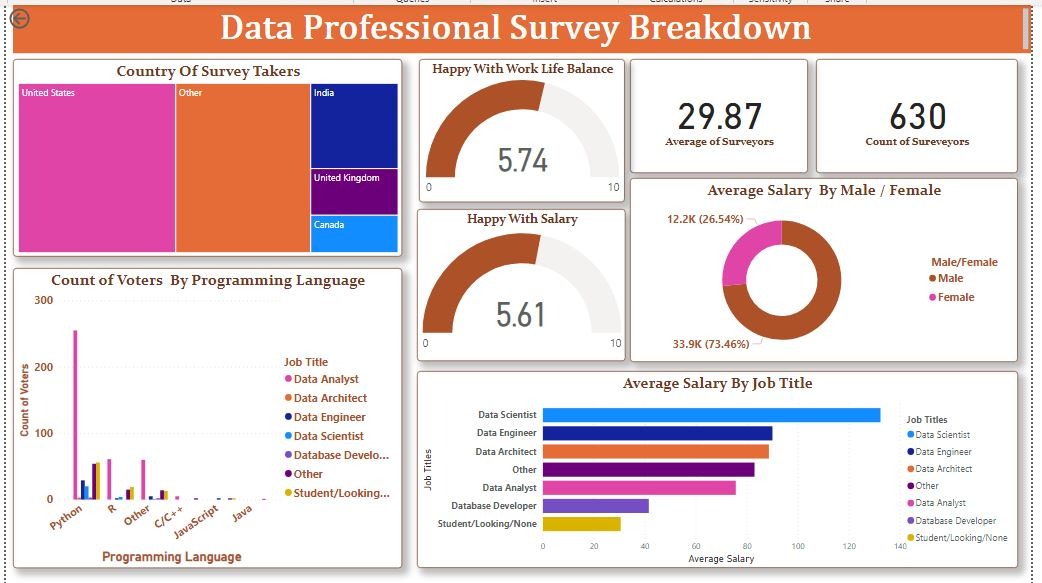
Analyzed 630 data professionals globally. Python is #1 skill across all roles. Data Scientists earn highest salaries, gender pay gap clearly identified. Avg work-life balance score 5.74/10.
View on GitHub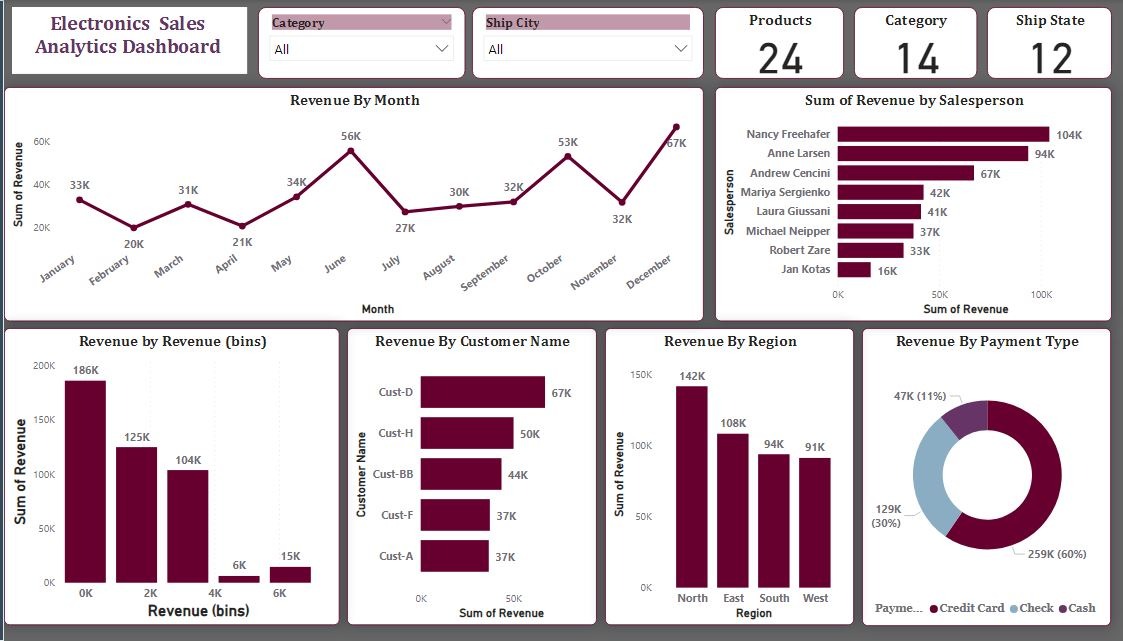
December peak at $67K revenue, top salesperson Nancy drove $104K in total, North region leads at $142K. Credit cards account for 60% of all payments. Seasonal promotion timing recommendations provided.
View on GitHub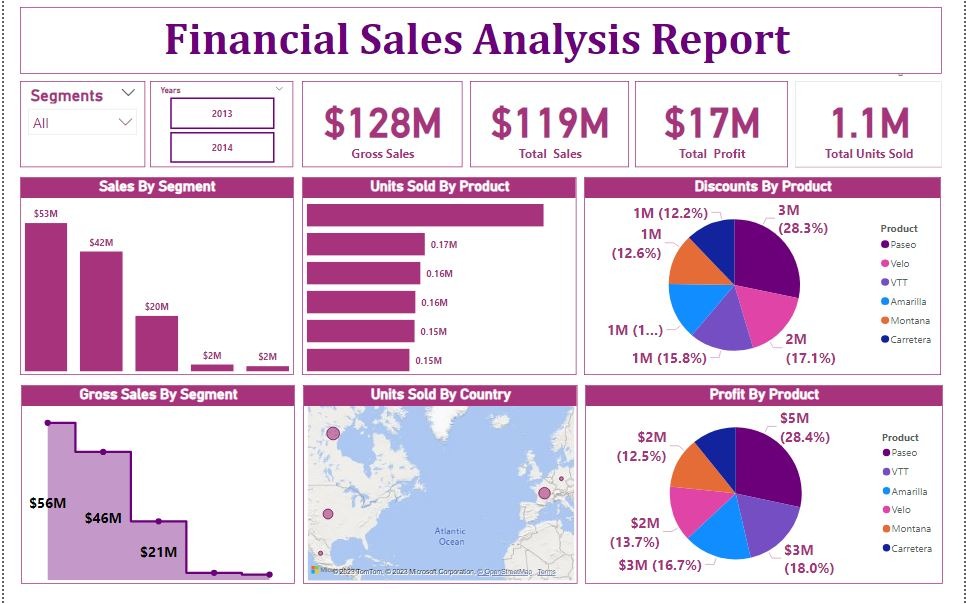
Analyzed $128M gross sales across product segments and geographies 2013–2014. Paseo is top profit product at $5M (28% of total profit). Velo discount share of 28% identified as a margin risk.
View on GitHub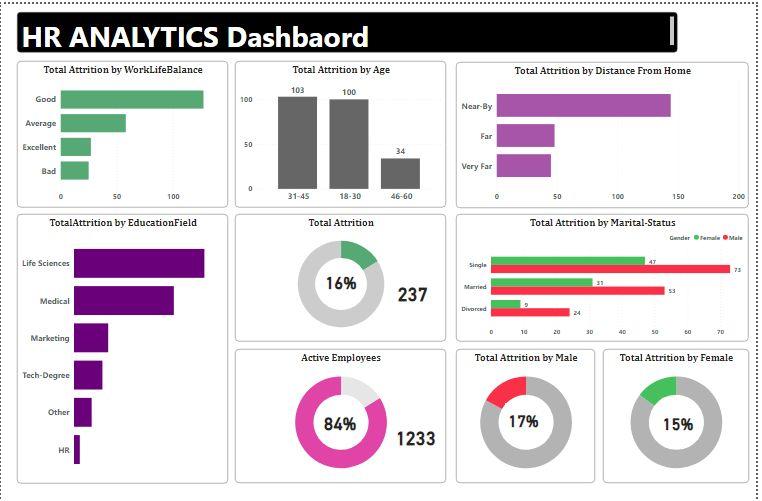
Analyzed 16% org-wide attrition. Life Sciences at 39% turnover costing Rs.2.8 Cr annually. Overtime workers and bottom-quartile salaries are top churn drivers. Interventions projected to save Rs.3.1 Cr per year.
View on GitHub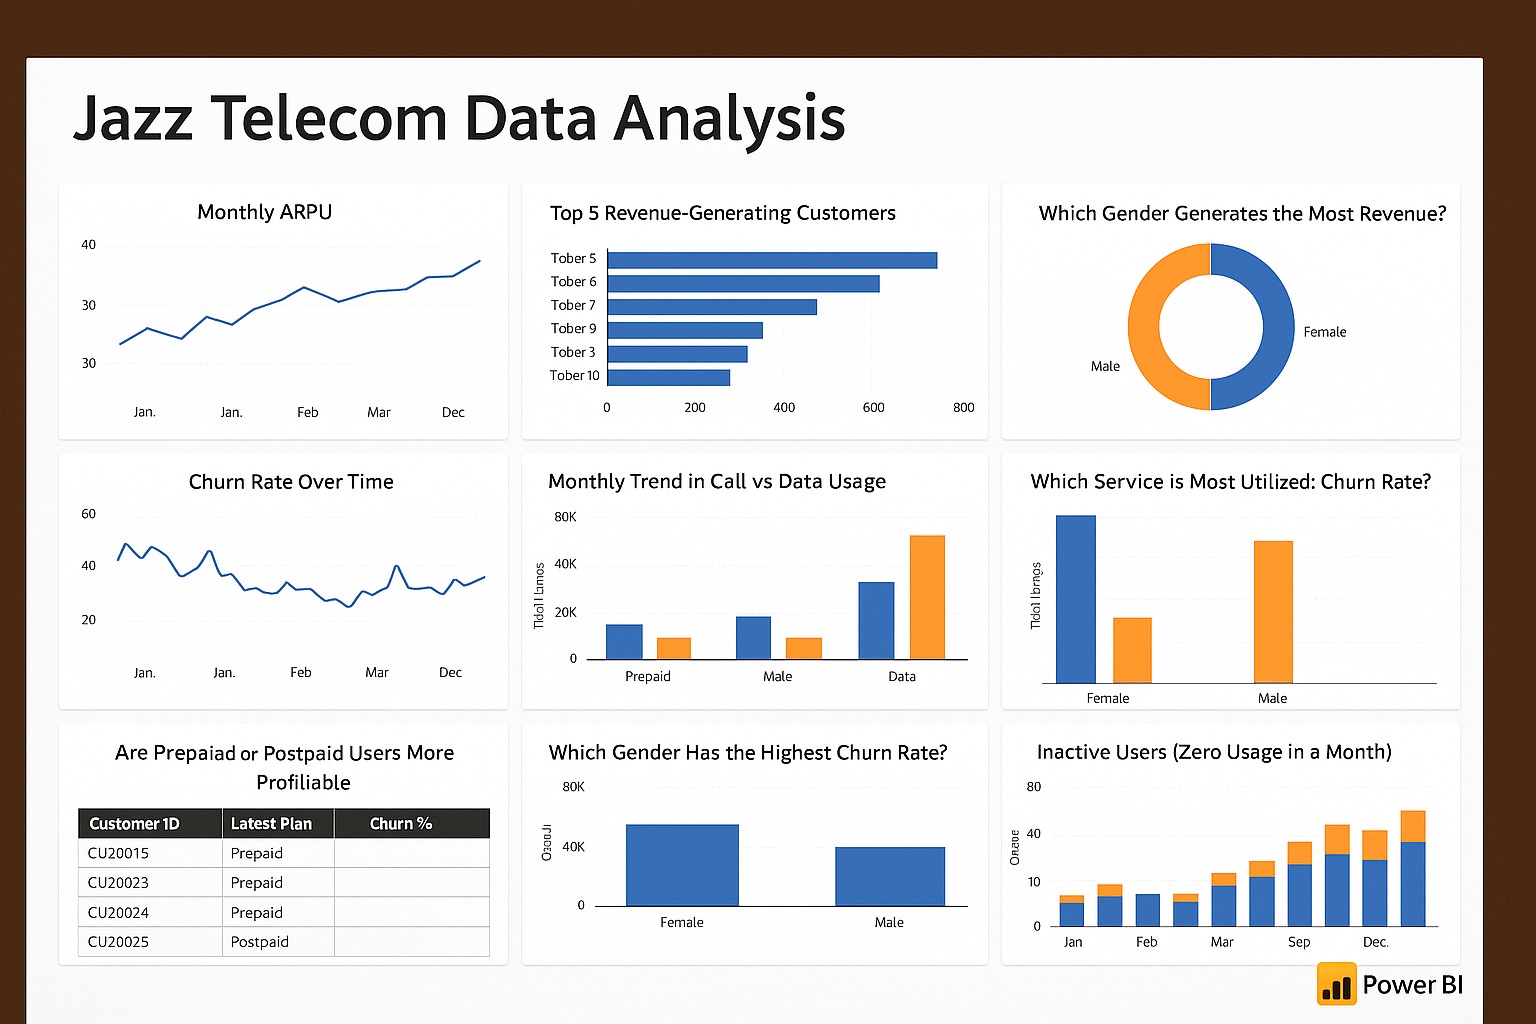
Postpaid users show higher ARPU, data demand overtaking voice calls, early churn signals detected via CTEs and DATEDIFF logic. 12 business questions answered covering revenue, retention and plan optimization.
View on GitHub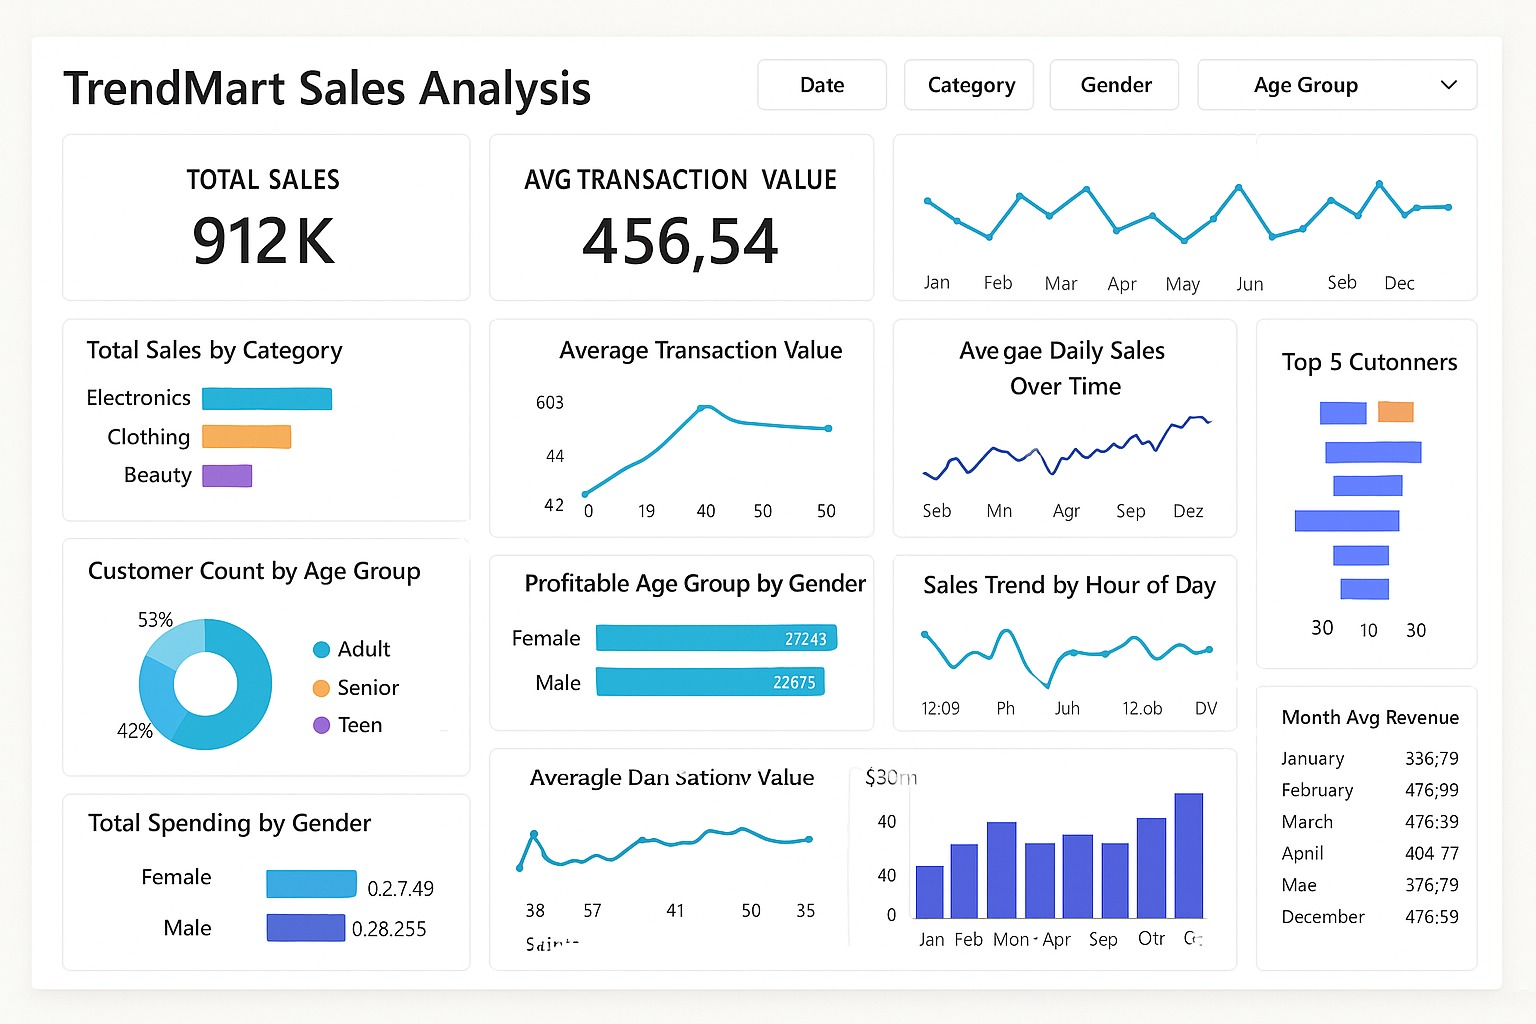
Rs.912K total sales. Electronics leads all categories, Adults 53% largest customer segment. Peak revenue months Feb, Mar and Dec identified. Age/gender profitability breakdown and hourly sales heatmap included.
View on GitHub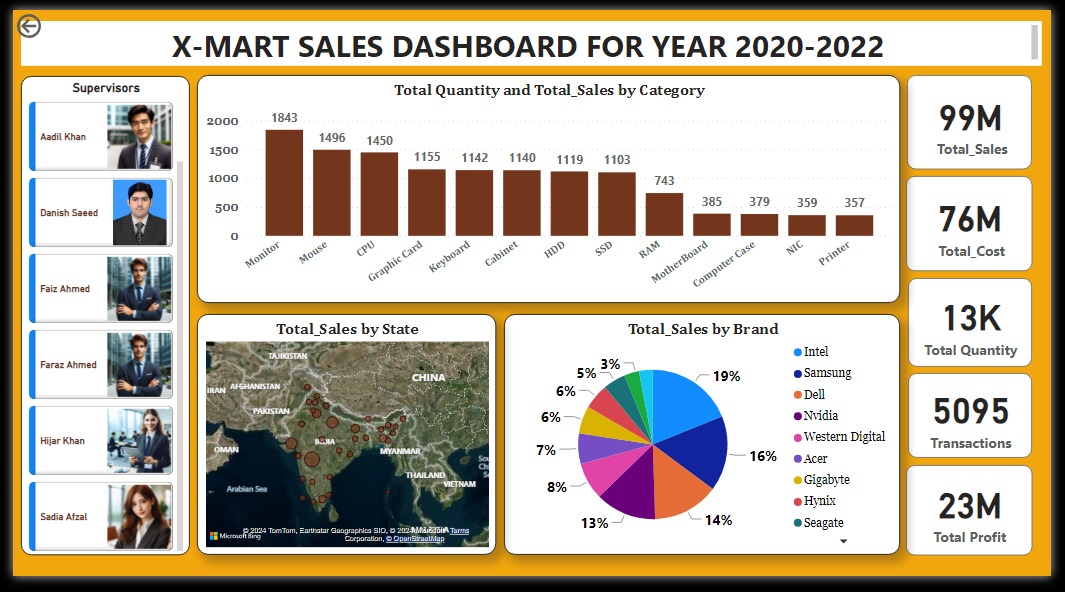
3-year analysis 2020–2022: $99M total revenue and $23M profit across 5,095 transactions. Intel (19%), Samsung (16%) and Dell (14%) top brands. Monitors and GPUs drive highest revenue.
View on GitHub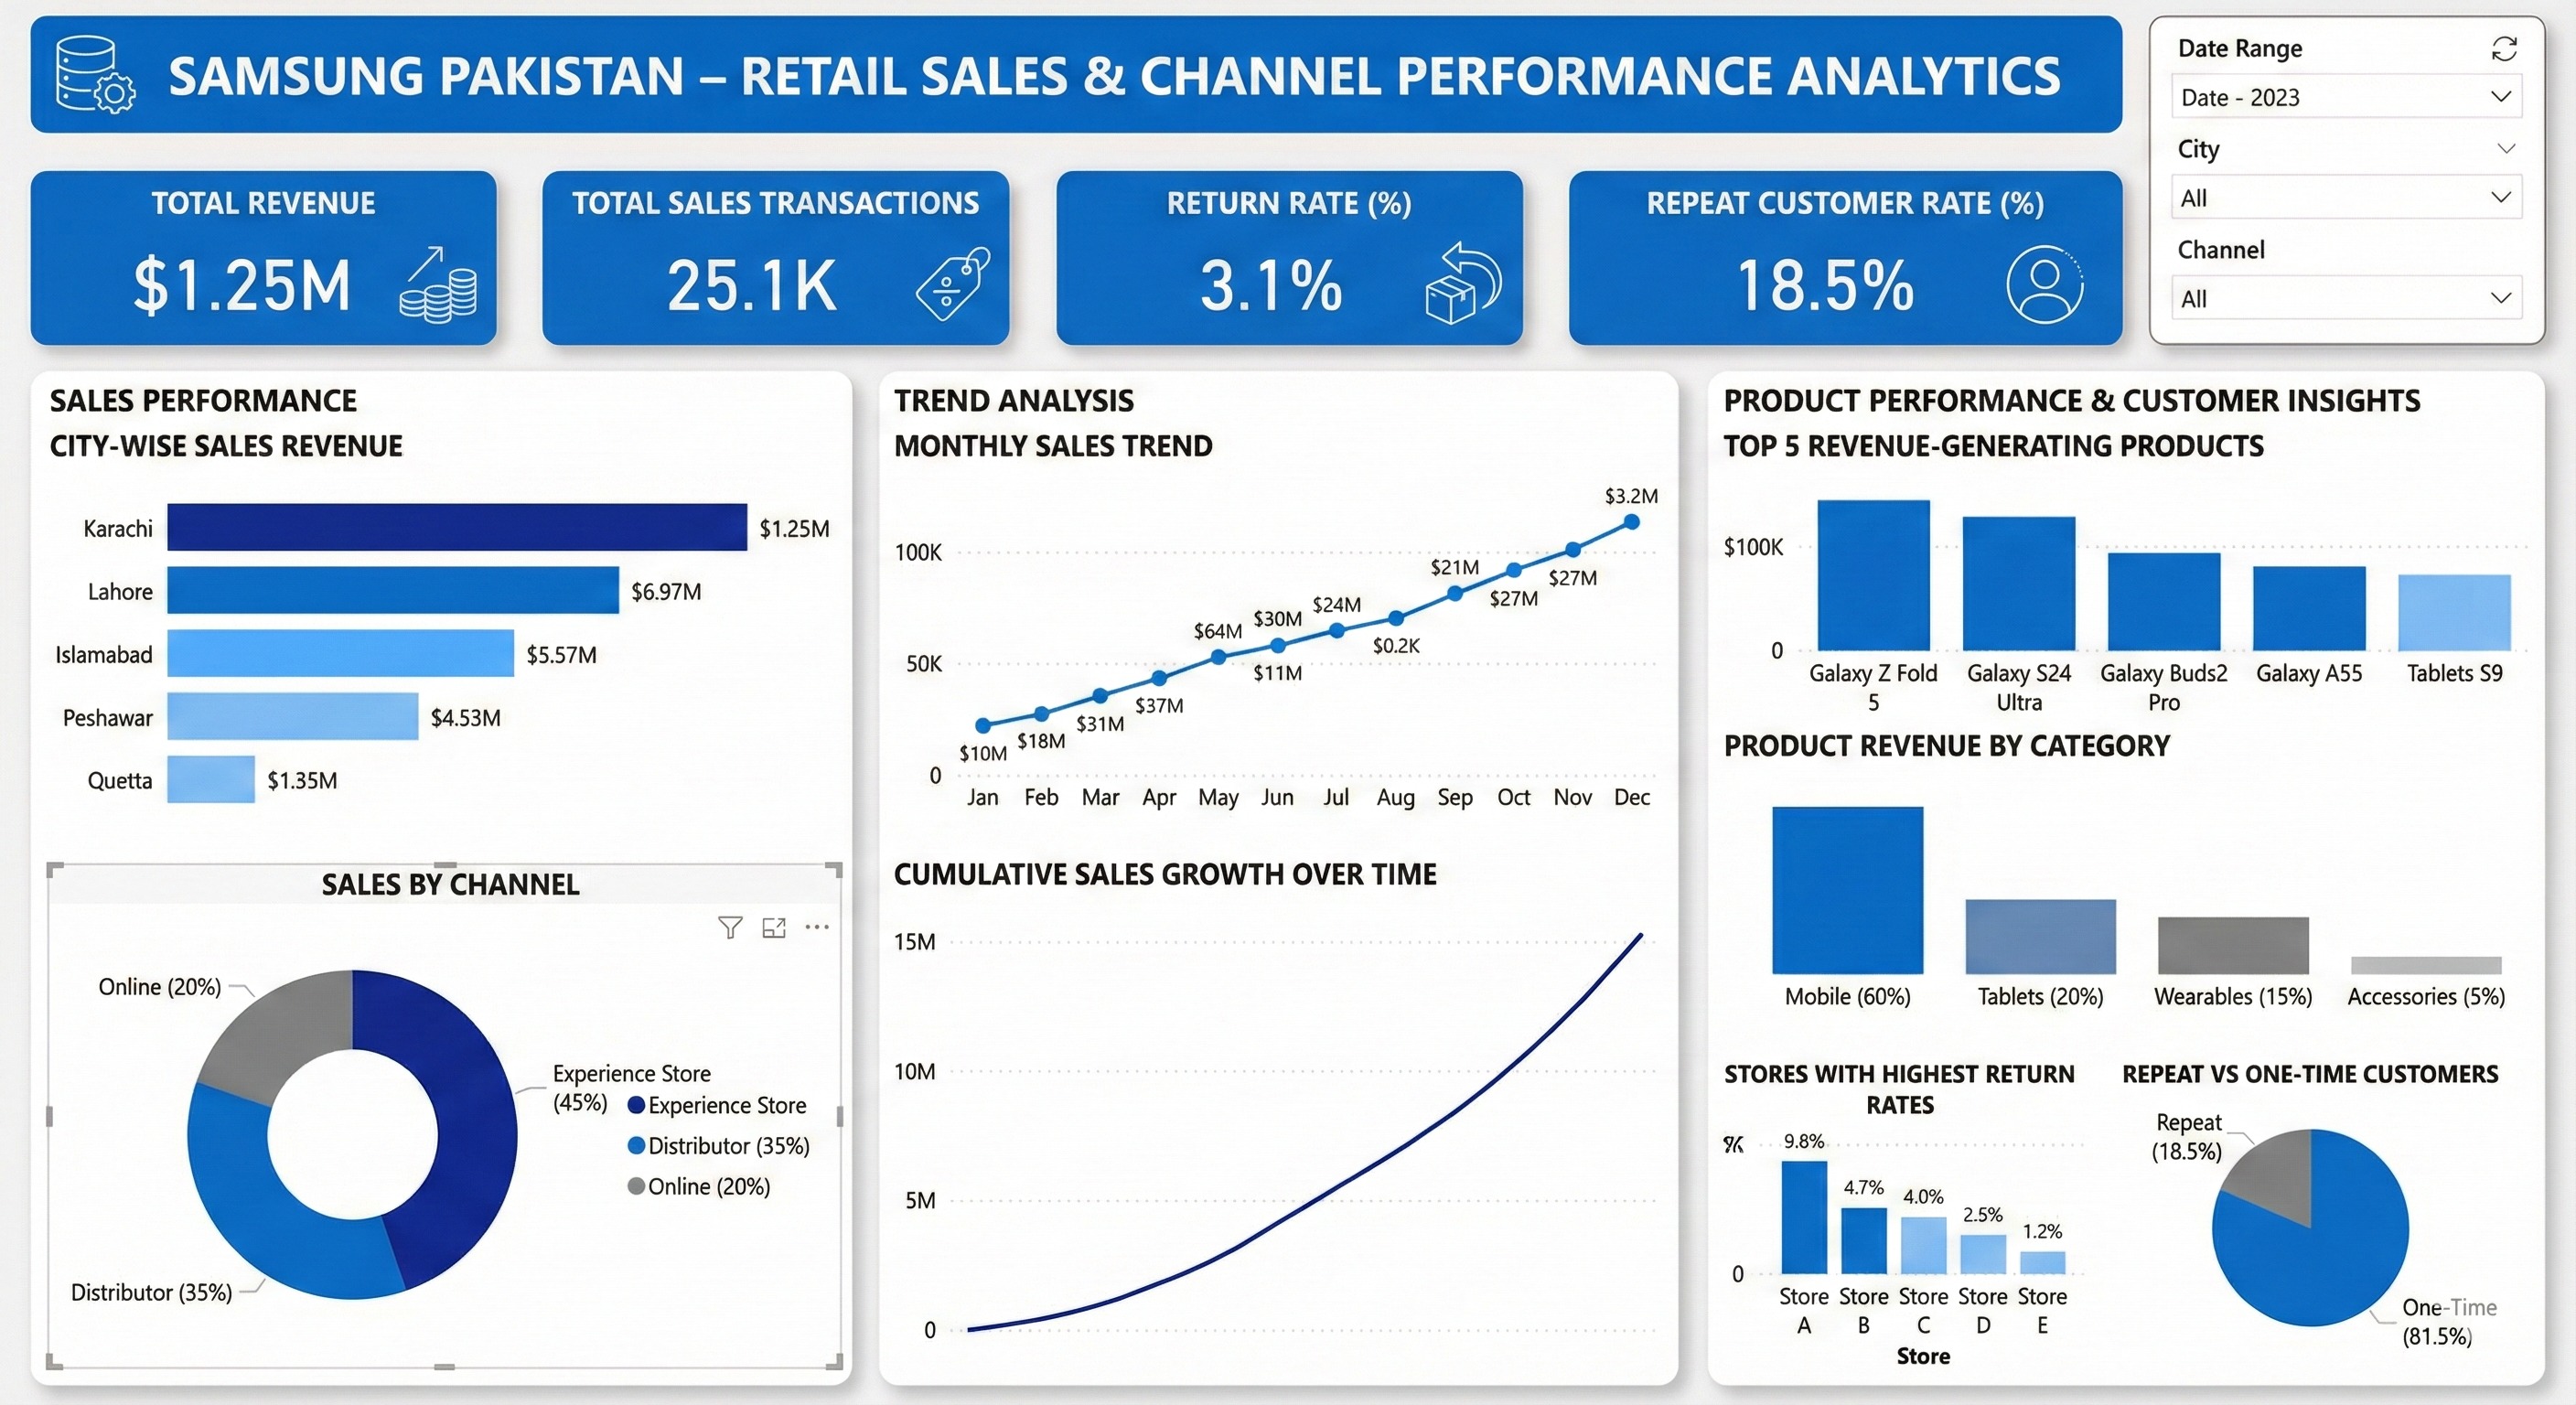
Nationwide retail analysis across 3 sales channels. Karachi top revenue city, Experience Stores lead all channels, distributor stores consistently miss targets. 7-table normalized relational model with full ER diagram.
View on GitHub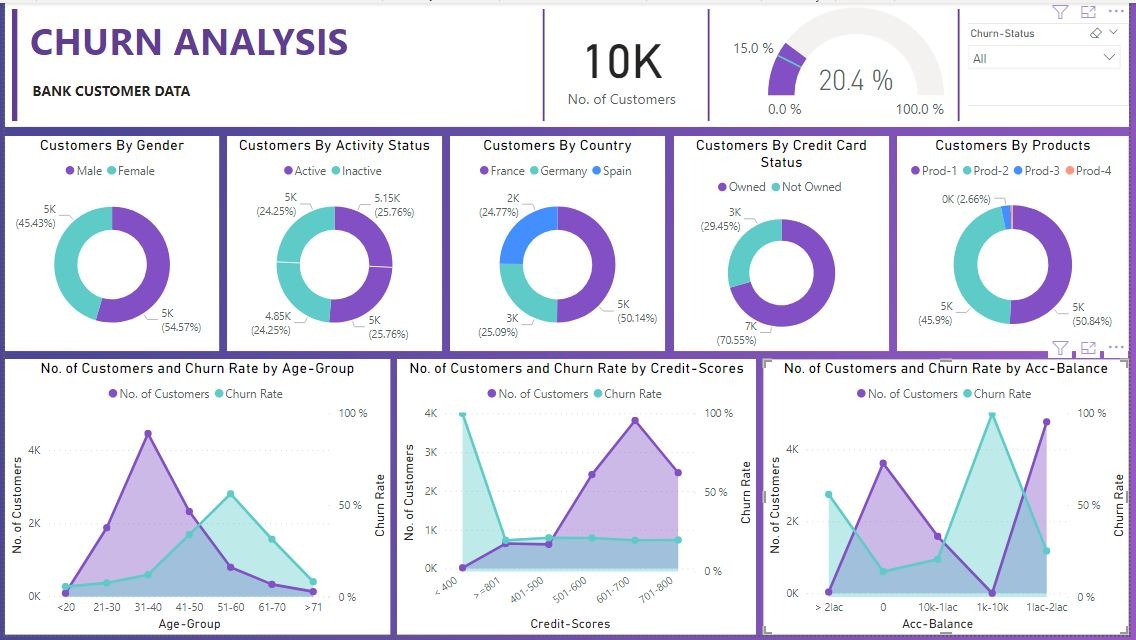
Analyzed 2,037 churned bank customers. Age group 31-40 at highest risk with ~50% churn rate. Product 4 at 69% churn rate. France and Spain are top churn regions. Targeted retention recommendations included.
View on GitHub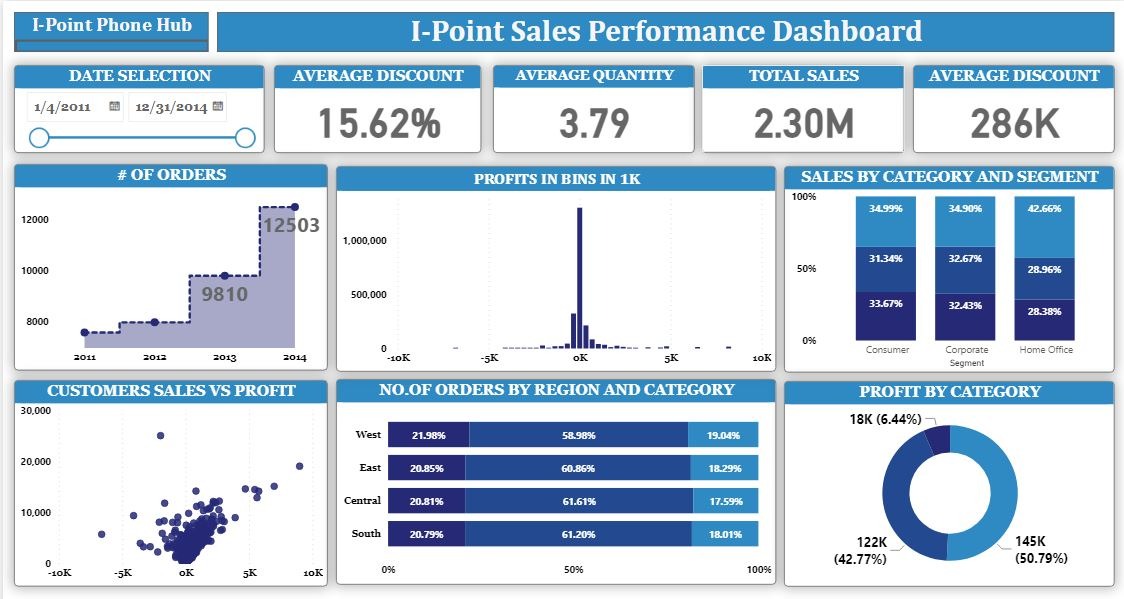
4-year analysis 2011–2014: revenue grew 304% to $2.30M but 34% avg discount is squeezing margins. Corporate segment most profitable despite lower volume. West region leads at 19% margin.
View on GitHub
Designed and analyzed an Amazon-style e-commerce database. Extracted Pareto trends, high-value customer segments, product profitability leaders and seasonal revenue patterns. Full ER diagram and relational schema included.
View on GitHub
Wellington at 18% cancellation rate — double city average. EVs generate highest fare per km, Gold-tier customers are top revenue segment. NZD 3.1M+ incremental revenue projected from SQL-driven strategy recommendations.
View on GitHub
Avg delivery at 58hrs vs 48hr SLA target. Bank payment return rate at 31.25%, 27% COD payments pending settlement. 6 critical operational problems solved. Projected 20% improvement in on-time delivery rate.
View on GitHubMoM revenue, order volume and quantity trends tracked via LAG Window Functions. Revenue stayed stable during low-order months, revealing a premium pricing effect. Seasonal demand spikes identified for smarter inventory planning.
View on GitHub
Simulated Airbnb Pakistan market across 10 cities using pure SQL. Stay_4 Karachi top revenue listing at PKR 147K, Lahore leads guest satisfaction at 4.2/5. Top 3 listings drive 63% of total revenue.
View on GitHub
Analyzed Spotify dataset covering tracks, albums and artists. Identified tracks with 1B+ streams, official video tracks correlate with higher engagement. Top 3 artists per city ranked via RANK Window Function.
View on GitHub